Vibe Points: 0
Get Vibe PointsYouTube Thumbnail Test Results
Help Center < YouTube Thumbnail Test Results
What do my YouTube thumbnail test results mean?
What does the YouTube thumbnail Rank analytic mean?
What does the YouTube thumbnail Demographics analytic mean?
What do my YouTube Thumbnail Test Results Mean?
Your YouTube thumbnail test results includes a number of analytical tools.
Overview
Overview Active
| Platform | Votes | Sample Size Quality | Overall Score |
|---|---|---|---|
| Youtube | 21 | Reliable | 4.67 / 10 |

👇 Average
Eye-catching: 4.3
👇 Average
Understandable: 5.9
👇 Average
Interesting: 3.8
-
I feel like the picture of you makes it confusing and less clickable. I also find it confusing
User_ORyviyee 1 hour ago
-
I don’t want to sound rude but dont put yourself on the thumbnail, i feel like is very full already. Or remove some stuff to make yourself look bigger
User_XTuyp8PN 5 hours ago
-
This thumbnail is too basic... I think there is too much text in this thumbnail...
User_ygfb2br0 2 days ago
-
I think this is a great thumbnail The text could be a bit bigger
User_7IkmBhsq 5 days ago
-
I think there is too much text in this thumbnail I think this thumbnail seems very unoriginal This thumbnail is too basic
User_xh85hmXu 5 days ago
-
I think there is too much text in this thumbnail I think this thumbnail is boring This thumbnail is too basic I think this thumbnail seems very unoriginal
User_FJ3Us8s45 1 week ago
-
I think there is too much text in this thumbnail
User_0pvfUxsW 1 week ago
-
This thumbnail is very clear
User_QPpw9d47 1 week ago
-
I think this is a great thumbnail I think this thumbnail is perfect
User_Xx03tJKd 4 days ago
-
This thumbnail seems unclear to me The thumbnail appears pixelated to me
BachPhotography 1 week ago
FREE, PLUS and PRO users have access to the Overview analytic.
The overview section of YouTube thumbnail analytics displays general information about your YouTube thumbnail's performance. In the left-most table cell, the platform on which the thumbnail will appear is displayed. This is because PicVibe will support other platforms and social media in the future.
The next table cell is the total number of thumbnail ratings received on the YouTube thumbnail.
The next table cell is a verbal sentiment about the sample size of ratings on this YouTube thumbnail test.
The next table cell is the overall average score across the three rating metrics (eye-catching, understandable and interesting).
Beneath that is an image preview of your YouTube thumbnail, and a tabbed menu of the individual scores across each rating metric. You can see the average eye-catching, understandable and interesting score for your YouTube thumbnail test for your thumbnail ratings.
There is a marker (👇 Average) above each metric, pointing to the average score for the past 1000 YouTube thumbnail tests, on that particular metric.
The other tab in the tabbed menu is a list of all comments received on your YouTube thumbnail tests. PLUS and PRO users can follow the comments to a list of other users' thumbnail tests, and have a look at the analytics and ratings they received.
Rank
Rank
The average overall score was 5.49. Your score was 4.67.
This test's performance was in the 31st percentile.
This test's "overall" performance was fair.
| Average Score | Your Score | Rank Percentile | Performance |
|---|---|---|---|
| 5.49 | 4.67 | 31st | Fair |
μ
2σ
σ
-σ
-2σ
0 5.49 10
The average eye-catching score was 5.54. Your score was 4.30.
This test's performance was in the 24th percentile.
This test's "eye-catching" performance was poor.
| Average Score | Your Score | Rank Percentile | Performance |
|---|---|---|---|
| 5.54 | 4.30 | 24th | Poor |
μ
2σ
σ
-σ
-2σ
0 5.54 10
The average interesting score was 4.70. Your score was 3.80.
This test's performance was in the 32nd percentile.
This test's "interesting" performance was fair.
| Average Score | Your Score | Rank Percentile | Performance |
|---|---|---|---|
| 4.70 | 3.80 | 32nd | Fair |
μ
2σ
σ
-σ
-2σ
0 4.70 10
The average understandable score was 6.21. Your score was 5.90.
This test's performance was in the 44th percentile.
This test's 'understandable' performance was fair.
| Average Score | Your Score | Rank Percentile | Performance |
|---|---|---|---|
| 6.21 | 5.90 | 44th | Fair |
μ
2σ
σ
-σ
-2σ
0 6.21 10
PLUS and PRO users have access to the Rank analytic.
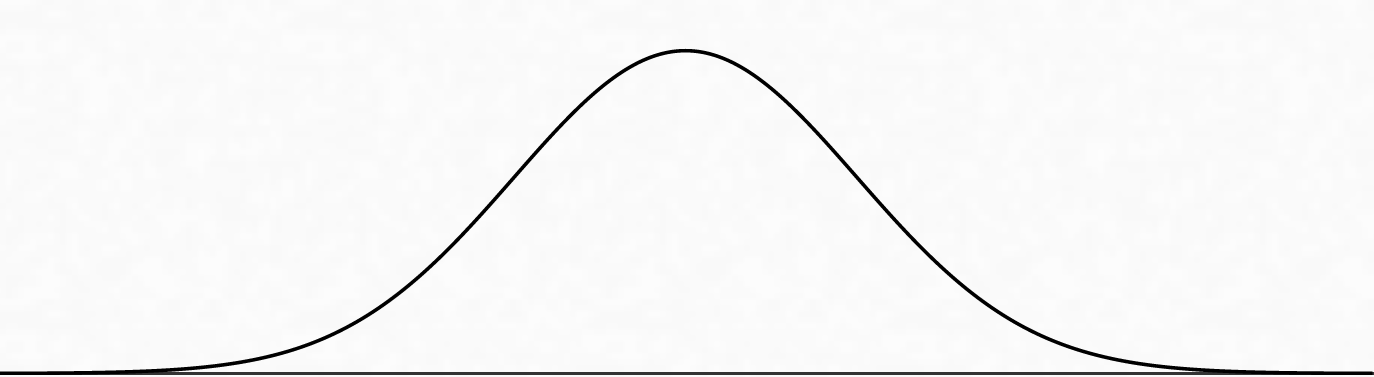
The rank analytics displays where your thumbnail performed in comparison to other YouTube thumbnail tests on PicVibe. The rank analytic places your thumbnails performance on a Gaussian Distribution (Normal Distribution), for each performance metric (eye-catching, understandable, interesting).
The rank card also verbally states how your YouTube thumbnail performed compared to the previous 1000 thumbnail tests on the site, by telling you the average score of thumbnails and how yours scored, across all metrics.
The rank card also lets you know in which percentile your thumbnail test scores, across each metic.
Finally, the rank card provides you with a verbal sentiment regarding how your thumbnail test performed compared to the average across the last 1000 YouTube thumbnail tests.
Demographics
Demographics
This test was considered most eye-catching, with a score of 6.67/10 in the following countries: United Kingdom.
This test was considered least eye-catching, with a score of 0.00/10 in the following countries: United Arab Emirates, , Mexico.
This test was considered most understandable, with a score of 10.00/10 in the following countries: Mexico.
This test was considered least understandable, with a score of 0.00/10 in the following countries: New Zealand.
This test was considered most interesting, with a score of 6.60/10 in the following countries: , India.
This test was considered least interesting, with a score of 0.00/10 in the following countries: United Arab Emirates, , Mexico.
PLUS and PRO users have access to the Demographics analytic.
The demographics analytic displays information about the countries in which your YouTube thumbnail was most and least popular across each metric (Eyecatching, understandable and interesting). There is an interactive world map, for each metric, in which each country is coloured at various intensity, dependant on the performance of your YouTube thumbnail within the chosen metric. Darker countries show that your thumbnail was more well-received.
Above the various demographics analytics map is a verbal description of how your YouTube thumbnail performed. It details in which country your YouTube thumbnail test performed best, and in which country it performed worse. This information is available across each metric.
Votes
Votes
Is the thumbnail eye-catching?
Is the thumbnail understandable?
Is the thumbnail interesting?
Your thumbnail test has received 26 votes, since it was created 1 week ago
PLUS and PRO users have access to the Votes analytic.
The votes analytics shows the number of votes across each metric on your YouTube thumbnail tests. You can hover your cursor over one of the bars within one of the three bar charts, to see the exact number of ratings of a particular score across any metric.
Beneath the votes charts, you will see a verbal description of the number of votes your YouTube thumbnail test has received, and the time elapsed since the YouTube thumbnail test was created.
Audience
Audience
Sex
Age
PLUS and PRO users have access to the Audience analytic.
The audience analytic shows the user-reported-sex of each user who has voted on your thumbnail, and the user-reported age of each user who rated your YouTube thumbnail. You can hover over the donut chart to see how many votes you received from each audience type.